
The EFL Championship, often dubbed the most competitive league in the world, is a rollercoaster ride of dramatic twists, nail-biting finishes, and unexpected rises and falls. More than just a stepping stone to the Premier League, it’s a league steeped in history and passion, where every game matters. Understanding the key statistics not only enhances the viewing experience but also provides valuable insights into team performance, player potential, and the overall dynamics of this enthralling competition. This article delves deep into EFL Championship stats, exploring the key metrics, trends, and narratives that shape the league, answering common queries, and providing a comprehensive overview of what makes this league so captivating.
Goals, Goals, Goals: Attacking Prowess and Defensive Resilience
One of the most fundamental aspects of football is scoring goals, and the Championship is no exception. Analyzing goal-related stats can reveal a lot about a team’s playing style and effectiveness.
Goals Scored: This stat reflects a team’s attacking potency. Top-scoring teams often employ an attacking brand of football, creating numerous chances and possessing clinical finishers. However, simply scoring a lot of goals doesn’t guarantee success, as defensive frailties can undermine even the most prolific attacks. Looking at goals scored per game can offer a more normalized view, especially when comparing teams that have played different numbers of matches.
Goals Conceded: A strong defense is the bedrock of any successful team. The number of goals conceded indicates a team’s defensive solidity and organizational discipline. Teams with low goals conceded figures often possess well-drilled defenses, effective goalkeepers, and a robust tactical setup. Similar to goals scored, looking at goals conceded per game provides a fairer comparison.
Goal Difference: This metric, calculated by subtracting goals conceded from goals scored, provides a clear picture of a team’s overall performance. A positive goal difference suggests a team is performing well both offensively and defensively, while a negative goal difference indicates underlying issues that need addressing. Goal difference often plays a crucial role in determining league positions, especially when teams are tied on points.
Shot Accuracy: This stat measures a team’s efficiency in front of goal. It represents the percentage of shots that are on target. A high shot accuracy suggests clinical finishing and quality in the final third. However, it’s important to note that a high shot accuracy doesn’t always translate to more goals, as the quality of chances also plays a significant role.
Conversion Rate: This metric takes shot accuracy a step further, measuring the percentage of shots that result in a goal. A high conversion rate indicates a team’s ability to capitalize on their chances and convert them into goals. This is a crucial stat for strikers and attacking players, reflecting their effectiveness in front of goal.
Beyond Goals: Possession, Passing, and Playmaking
While goals are the ultimate currency in football, the game is much more nuanced. Analyzing possession, passing, and playmaking stats can provide insights into a team’s tactical approach and style of play.
Possession Percentage: This stat measures the amount of time a team spends in possession of the ball. Teams that dominate possession often employ a possession-based style of play, aiming to control the game and dictate the tempo. However, possession alone doesn’t guarantee success. It’s how a team utilizes possession that truly matters.
Passing Accuracy: This metric reflects the percentage of successful passes a team makes. High passing accuracy indicates good technical ability and understanding between players. Teams that prioritize possession often have high passing accuracy, as they aim to keep the ball moving and create opportunities.
Key Passes: These are passes that directly lead to a goal-scoring opportunity. The number of key passes a team makes highlights their creativity and ability to create chances. Players with high key pass numbers are often the team’s playmakers and creative sparks.
Assists: An assist is a pass that directly leads to a goal. This stat reflects a player’s ability to create scoring opportunities for their teammates. Players with high assist numbers are often crucial to a team’s attacking success.
Defensive Prowess: Tackles, Interceptions, and Clean Sheets
Defensive statistics are just as important as attacking stats. They provide insights into a team’s defensive organization, individual player contributions, and overall resilience.
Tackles: This stat measures the number of tackles a player makes. While a high number of tackles can indicate a player’s commitment and aggression, it can also suggest that the team is spending a lot of time defending.
Interceptions: An interception occurs when a player successfully intercepts a pass intended for an opponent. This stat reflects a player’s reading of the game and ability to anticipate opposition attacks.
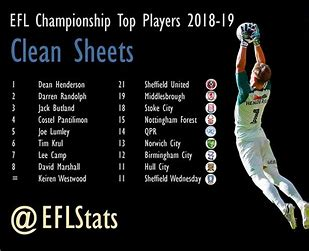
Clean Sheets: A clean sheet is achieved when a team prevents their opponents from scoring any goals. This stat is a testament to a team’s defensive solidity and the effectiveness of their goalkeeper. Consistent clean sheets are often a hallmark of successful teams.
Player Performance: Individual Brilliance and Team Cohesion
Analyzing individual player stats can reveal standout performers, identify areas of improvement, and provide insights into player contributions.
Top Scorers: This list highlights the players who have scored the most goals in the league. These players are often the team’s main attacking threats and crucial to their success.
Top Assisters: This list showcases the players who have provided the most assists in the league. These players are often the team’s playmakers and creative forces.
Pass Completion Rate: This stat measures the percentage of successful passes a player makes. High pass completion rates indicate good technical ability and decision-making.
Tackles per Game: This stat measures the average number of tackles a player makes per game. It can provide insights into a player’s defensive contribution and work rate.
Yellow and Red Cards: These stats reflect a player’s disciplinary record. A high number of yellow or red cards can indicate a player’s aggression and tendency to make rash challenges.
EFL Championship Trends and Narratives
Beyond individual stats, it’s important to consider broader trends and narratives that shape the EFL Championship. These can include:
Home Advantage: Historically, teams tend to perform better at home. Analyzing home and away records can reveal a team’s strengths and weaknesses in different environments.
Form and Momentum: Football is a game of momentum. Teams on winning streaks often have a psychological edge, while teams struggling for form can find it difficult to turn things around.
Managerial Impact: The manager’s influence on a team’s performance is undeniable. Analyzing a team’s stats under different managers can reveal the impact of tactical changes and leadership styles.
Transfer Window Impact: The transfer window can significantly impact a team’s squad and overall performance. Analyzing a team’s transfer activity and subsequent results can provide insights into the effectiveness of their recruitment strategy.
Play-off Dynamics: The Championship play-offs are a unique and high-stakes competition. Understanding the historical trends and statistical patterns in the play-offs can be valuable for predicting outcomes.
FAQs
What is the EFL Championship?
The EFL Championship, known for sponsorship reasons as the Sky Bet Championship, is the second-highest division in English football, just below the Premier League. It comprises 24 clubs competing annually from August to May. The top two teams at the end of the season are automatically promoted to the Premier League, while the next four teams enter a playoff for the third promotion spot.
How many matches are played in a Championship season?
Each team plays 46 matches in a season—23 at home and 23 away—resulting in a total of 552 matches across the league. This extensive schedule contributes to the league’s reputation for high intensity and competitiveness.
What is the average attendance in the EFL Championship?
The Championship boasts impressive attendance figures. In the 2023–24 season, the average attendance was 23,048 spectators per game, making it the second most-watched second-tier domestic sports league globally, just behind Germany’s 2. Bundesliga.
Who holds the record for the most goals scored in a single Championship season?
George Camsell set an extraordinary record by scoring 59 goals in just 37 games during the 1926/27 season, a feat that remains unmatched in the league’s history.
Which club has won the most EFL Championship titles?
Leicester City holds the record for the most Championship titles, having won the league eight times.
How is the EFL Championship structured?
The league operates on a promotion and relegation system. The top two teams at the end of the season are promoted to the Premier League. Teams finishing third to sixth enter a playoff, with the winner also earning promotion. Conversely, the bottom three teams are relegated to EFL League One.
What is the financial landscape of the EFL Championship?
While the Premier League often dominates financial discussions, the Championship is also a significant economic entity. The average weekly wage for a Championship player is approximately £10,000, with some clubs offering salaries comparable to those in the Premier League. However, the financial disparity between the Championship and the top-tier leagues remains a topic of concern.
How does the EFL Championship compare to other leagues in terms of attendance?
The Championship is the fifth most-watched league in Europe, with an average attendance of 23,048 spectators per game in the 2023–24 season. This high attendance underscores the league’s popularity and the passionate support of its fanbase.
What are some notable records in the EFL Championship?
Highest Average Attendance: The 2023–24 season saw an average attendance of 23,048 spectators per game.
Biggest Home Win: Leeds United achieved a 7–0 victory over Cardiff City on February 1, 2025.
Biggest Away Win: Plymouth Argyle secured a 5–0 win against Burnley on January 22, 2025.
How are player wages distributed across the EFL divisions?
The Championship exhibits a significant wage disparity compared to the Premier League. The average weekly wage for a Championship player is around £10,000, with some clubs offering salaries comparable to those in the Premier League. This financial structure has led to substantial financial losses for many clubs, highlighting the economic challenges within the league.
To conclude
The EFL Championship stands as a cornerstone of English football, offering a unique blend of competitiveness, rich history, and passionate fan engagement. Its structure, financial dynamics, and the fervor of its supporters contribute to its reputation as one of the most exciting leagues in the world. Understanding the statistics and records of the Championship provides valuable insights into the league’s evolution and the remarkable achievements of its clubs and players.
To read more , click here